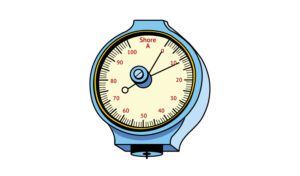
Hardness, as applied to elastomers, is defined as the relative resistance of a surface to indention by an indenter of a specified dimension under a specified load. The instrument most commonly used to measure hardness is a durometer. With this tool, numerical hardness values are derived from the depth of penetration. The harder the sample, the farther it will push back the indenter point, and the higher the readings. On the durometer A scale, 0 is very soft, and 100 is very hard. Values are usually read immediately after firm contact has been established.
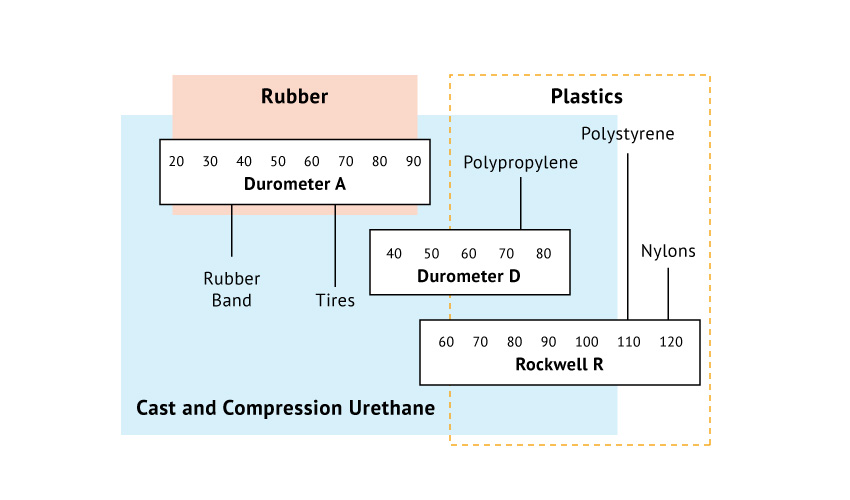
The hardness range of elastomers is so broad that a single durometer cannot indicate practical, measurable differences of hardness. For this reason, durometers are available in more than one scale model (eg., A and D scale durometers). The A scale durometer is widely used throughout the rubber industry. The durometer D model, which has a stiffer spring and a more pointed indenter, is used to measure the hardness of hard urethanes and thermoplastics.
 Mechanical limitations of durometers, plus variations in the way people use them, cause inconsistencies in hardness measurements. Also, since elastomer deformation occurs, indenter penetration is reduced immediately, as all elastomers will inherently try to yield. It is not uncommon to find a difference of 5 points in individual hardness readings of an elastomer specimen. Tabletop durometers can measure hardness more accurately, but they are not as convenient and are not used routinely.
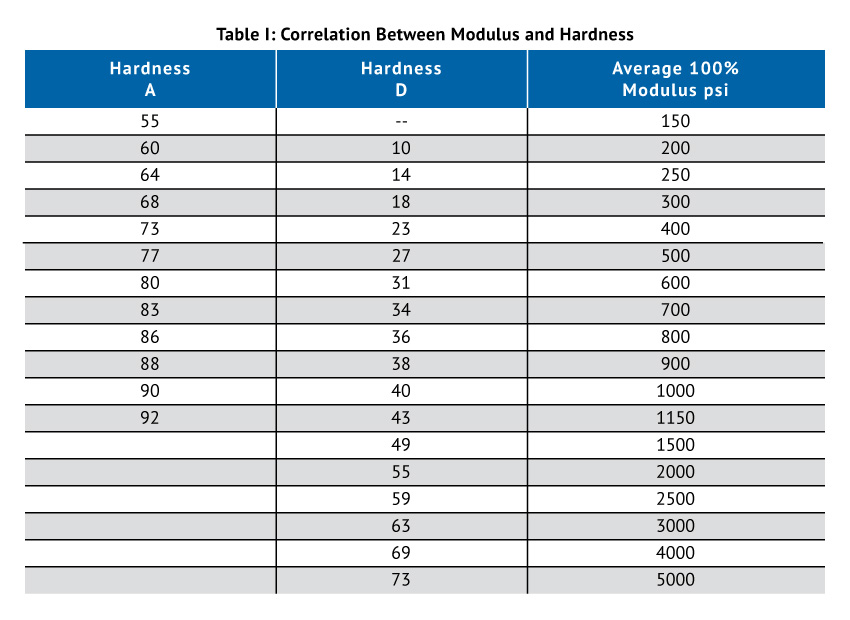
Frequently, hardness is assumed to correlate with stiffness (modulus), but this is not always true. Variations of a few points in hardness can show a marked difference in modulus. Table I shows a general correlation between hardness and modulus in urethane at 100% elongation.
 A linear relationship between durometers A and D does not exist. Approximate equivalent readings for durometer A and durometer D are shown in Table II.
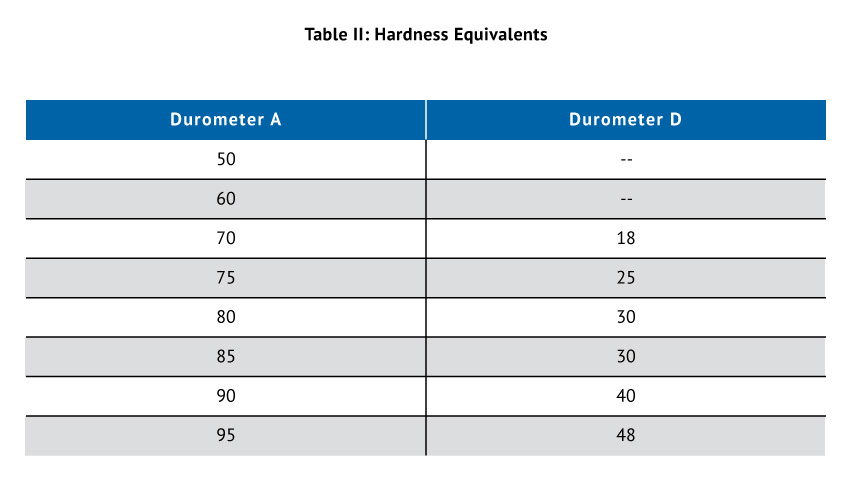 Hardnesses above 95 on the A scale should not be specified, because the upper accuracy limit of the instrument would be approached. Accuracy at the lower end of the D scale is also limiting, and thus values below 25D are questionable.
Access more articles in our Rubber Knowledge Center and our Urethane Knowledge Center.